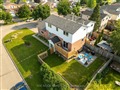
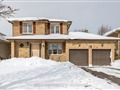
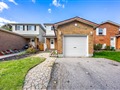
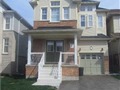
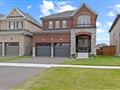
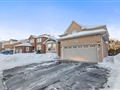
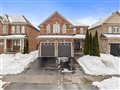
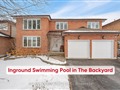
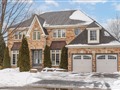
64 Sandringham Dr
$815,231
Comparative Market Analysis
May 30, 2025
NOT AN ACTIVE LISTING
Historical Performance
| Period | $ Change | % Change |
| 1 Day | +$245 | +0.030% |
| 7 Days | +$205 | +0.025% |
| 30 Days | -$1,300 | -0.159% |
| 3 Months | -$2,183 | -0.267% |
| 6 Months | +$13.6k | +1.69% |
| 1 Year | -$37.1k | -4.36% |
| 3 Years | +$150k | +22.6% |
| 5 Years | +$261k | +47.1% |
| 10 Years | +$497k | +156% |
List My Property
Real Estate Statistics
Financing Solutions
AS SEEN ON


Are You a Licensed Real Estate Agent or Broker?