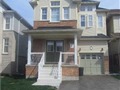
6 Thornbury Crt
$1,465,355
Comparative Market Analysis
Jun 5, 2025
NOT AN ACTIVE LISTING
Historical Performance
| Period | $ Change | % Change |
| 1 Day | +$440 | +0.030% |
| 7 Days | +$233 | +0.016% |
| 30 Days | -$3,005 | -0.205% |
| 3 Months | -$6,081 | -0.413% |
| 6 Months | +$20.0k | +1.38% |
| 1 Year | -$76.9k | -4.99% |
| 3 Years | +$244k | +19.9% |
| 5 Years | +$427k | +41.1% |
| 10 Years | +$840k | +134% |
List My Property
Real Estate Statistics
Financing Solutions
AS SEEN ON


Are You a Licensed Real Estate Agent or Broker?