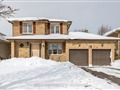
53 Birchfield Dr
$885,301
Comparative Market Analysis
Jun 25, 2025
NOT AN ACTIVE LISTING
Historical Performance
| Period | $ Change | % Change |
| 1 Day | +$266 | +0.030% |
| 7 Days | +$220 | +0.025% |
| 30 Days | -$1,428 | -0.161% |
| 3 Months | -$2,407 | -0.271% |
| 6 Months | +$14.7k | +1.69% |
| 1 Year | -$40.2k | -4.35% |
| 3 Years | +$165k | +22.9% |
| 5 Years | +$286k | +47.8% |
| 10 Years | +$530k | +149% |
List My Property
Real Estate Statistics
Financing Solutions
Browsing History
31 Brownstone Cres, Clarington
5 seconds ago
AS SEEN ON


Are You a Licensed Real Estate Agent or Broker?