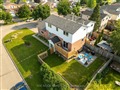
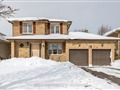
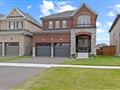
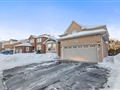
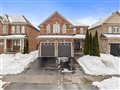
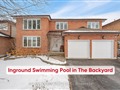
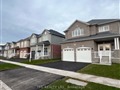
44 Fenning Dr
$858,053
Comparative Market Analysis
Jul 3, 2025
NOT AN ACTIVE LISTING
Historical Performance
| Period | $ Change | % Change |
| 1 Day | +$258 | +0.030% |
| 7 Days | +$192 | +0.022% |
| 30 Days | -$1,488 | -0.173% |
| 3 Months | -$2,679 | -0.311% |
| 6 Months | +$13.5k | +1.60% |
| 1 Year | -$40.8k | -4.54% |
| 3 Years | +$153k | +21.7% |
| 5 Years | +$266k | +45.0% |
| 10 Years | +$508k | +145% |
List My Property
Real Estate Statistics
Financing Solutions
Browsing History
131 Wellington St, Clarington
1 second ago
AS SEEN ON


Are You a Licensed Real Estate Agent or Broker?