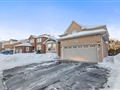
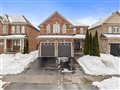
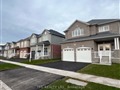
39 Montague Ave
$1,020,259
Comparative Market Analysis
Jul 3, 2025
NOT AN ACTIVE LISTING
Historical Performance
| Period | $ Change | % Change |
| 1 Day | +$306 | +0.030% |
| 7 Days | +$351 | +0.034% |
| 30 Days | -$1,151 | -0.113% |
| 3 Months | -$1,050 | -0.103% |
| 6 Months | +$20.9k | +2.09% |
| 1 Year | -$35.8k | -3.39% |
| 3 Years | +$228k | +28.7% |
| 5 Years | +$373k | +57.5% |
| 10 Years | +$621k | +156% |
List My Property
Real Estate Statistics
Financing Solutions
Browsing History
3 seconds ago
AS SEEN ON


Are You a Licensed Real Estate Agent or Broker?