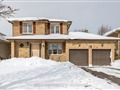
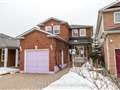
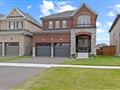
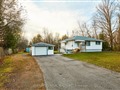
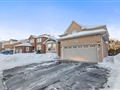
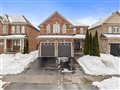
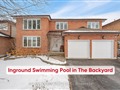
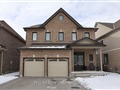
340 Sandringham Dr
$944,957
Comparative Market Analysis
Jun 25, 2025
NOT AN ACTIVE LISTING
Historical Performance
| Period | $ Change | % Change |
| 1 Day | +$284 | +0.030% |
| 7 Days | +$341 | +0.036% |
| 30 Days | -$995 | -0.105% |
| 3 Months | -$816 | -0.086% |
| 6 Months | +$19.4k | +2.10% |
| 1 Year | -$33.8k | -3.46% |
| 3 Years | +$209k | +28.3% |
| 5 Years | +$357k | +60.7% |
| 10 Years | +$607k | +180% |
List My Property
Real Estate Statistics
Financing Solutions
AS SEEN ON


Are You a Licensed Real Estate Agent or Broker?