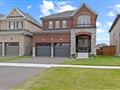
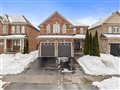
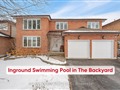
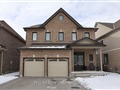
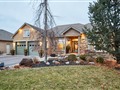
323 Sandringham Dr
$872,924
Comparative Market Analysis
Jun 25, 2025
NOT AN ACTIVE LISTING
Historical Performance
| Period | $ Change | % Change |
| 1 Day | +$262 | +0.030% |
| 7 Days | +$247 | +0.028% |
| 30 Days | -$1,254 | -0.143% |
| 3 Months | -$1,845 | -0.211% |
| 6 Months | +$15.7k | +1.83% |
| 1 Year | -$36.6k | -4.02% |
| 3 Years | +$175k | +25.0% |
| 5 Years | +$298k | +51.7% |
| 10 Years | +$515k | +144% |
List My Property
Real Estate Statistics
Financing Solutions
Browsing History
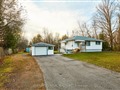
95 Beckett Cres, Clarington
5 seconds ago
AS SEEN ON


Are You a Licensed Real Estate Agent or Broker?