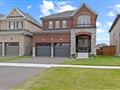
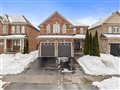
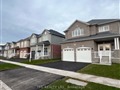
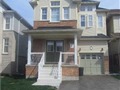
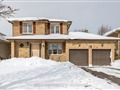
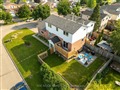
141 Fenning Dr
$1,080,048
Comparative Market Analysis
Jul 3, 2025
NOT AN ACTIVE LISTING
Historical Performance
| Period | $ Change | % Change |
| 1 Day | +$324 | +0.030% |
| 7 Days | +$203 | +0.019% |
| 30 Days | -$2,058 | -0.190% |
| 3 Months | -$3,957 | -0.365% |
| 6 Months | +$15.9k | +1.49% |
| 1 Year | -$53.8k | -4.75% |
| 3 Years | +$186k | +20.8% |
| 5 Years | +$320k | +42.0% |
| 10 Years | +$511k | +89.6% |
List My Property
Real Estate Statistics
Financing Solutions
AS SEEN ON


Are You a Licensed Real Estate Agent or Broker?