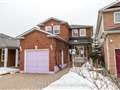
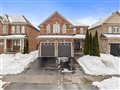
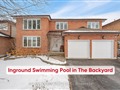
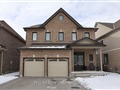
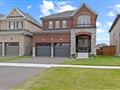
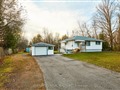
129 Richfield Sq
$1,198,848
Comparative Market Analysis
Jun 17, 2025
NOT AN ACTIVE LISTING
Historical Performance
| Period | $ Change | % Change |
| 1 Day | +$360 | +0.030% |
| 7 Days | +$190 | +0.016% |
| 30 Days | -$2,458 | -0.205% |
| 3 Months | -$4,975 | -0.413% |
| 6 Months | +$16.3k | +1.38% |
| 1 Year | -$62.9k | -4.99% |
| 3 Years | +$268k | +28.8% |
| 5 Years | +$584k | +95.1% |
| 10 Years | +$858k | +251% |
List My Property
Real Estate Statistics
Financing Solutions
AS SEEN ON


Are You a Licensed Real Estate Agent or Broker?