116 Sandringham Dr
$817,442
Comparative Market Analysis
Jun 25, 2025
NOT AN ACTIVE LISTING
Historical Performance
| Period | $ Change | % Change |
| 1 Day | +$245 | +0.030% |
| 7 Days | +$214 | +0.026% |
| 30 Days | -$1,264 | -0.154% |
| 3 Months | -$2,052 | -0.250% |
| 6 Months | +$13.9k | +1.73% |
| 1 Year | -$36.5k | -4.27% |
| 3 Years | +$154k | +23.2% |
| 5 Years | +$268k | +48.7% |
| 10 Years | +$500k | +158% |
List My Property
Real Estate Statistics
Financing Solutions
Browsing History
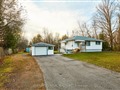
62 Sandringham Dr, Clarington
2 seconds ago
AS SEEN ON


Are You a Licensed Real Estate Agent or Broker?