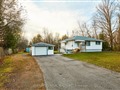
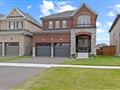
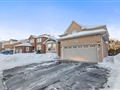
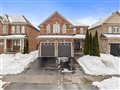
11 Alderbrook Dr
$882,545
Comparative Market Analysis
Jun 6, 2025
NOT AN ACTIVE LISTING
Historical Performance
| Period | $ Change | % Change |
| 1 Day | +$265 | +0.030% |
| 7 Days | +$316 | +0.036% |
| 30 Days | -$934 | -0.106% |
| 3 Months | -$689 | -0.078% |
| 6 Months | +$18.6k | +2.15% |
| 1 Year | -$29.6k | -3.24% |
| 3 Years | +$201k | +29.5% |
| 5 Years | +$313k | +54.9% |
| 10 Years | +$515k | +140% |
List My Property
Real Estate Statistics
Financing Solutions
Browsing History
15 Pinedale Cres, Clarington
1 second ago
38 Mahaffy Pl, Clarington
2 seconds ago
9 Claret Rd, Clarington
3 seconds ago
20 Empire Cres, Clarington
4 seconds ago
116 Buyson Cres, Clarington
5 seconds ago
176 Avondale Dr, Clarington
6 seconds ago
30 Hemmingway Dr, Clarington
7 seconds ago
94 Beechnut Cres, Clarington
8 seconds ago
53 Lyndale Cres, Clarington
9 seconds ago
AS SEEN ON


Are You a Licensed Real Estate Agent or Broker?